Tuesday, December 17, 2013

Document farm configuration settings in SharePoint 2013

Document farm configuration settings in SharePoint 2013

we can document  farm configuration settings in SharePoint 2013 by using Windows Power Shell.A very good article from MS how to do this.

Thanks to MS again.
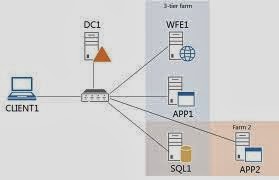


   v  MS Article: http://technet.microsoft.com/en-us/library/ff645391.aspx


Documenting your farm while things are working properly, will make finding troublesome changes a lot easier

Please Comment if you need Any Help.Your Feed back is always Welcome.I Am Happy to Help !!!!!

SharePoint Trouble shooting Methods and Tools

 SharePoint Trouble shooting Methods and Tools
                                         

We gather information by following the below methods to trouble shoot the SharePoint issue.
·        Application Logs: This Log will be generated in the System Application logs.
·        System Logs: This Log will be generated in the System  logs
·        ULS logs :This log would locate in the C:\Program Files\Common Files\Microsoft Shared\Web Server Extensions\15\LOGS

·        Developer Dash board tool: Check this Link(http://expertsharepoint.blogspot.de/2013/12/trouble-shooting-sharepoint-with-logs.html)


·         IIS Logs:  Stored in the c:\inetpub\logs\LogFiles by Default.


 IIS logs can be difficult to read. so we might check the Microsoft’s Log Parser at

       http://www.microsoft.com/en-us/download/details.aspx?id=24659 

IIS debug Tool
http://www.microsoft.com/en-my/download/details.aspx?id=40336 


 Other Tools : below are the other tools used for trouble shooting.

·        Fiddler: It is a webpage debugging tool that enables you to watch both incoming and outgoing web traffic. it’s a great way to troubleshoot slow page loads, Access Denied errors, Kerberos errors, pages that look wrong. We can download fiddler from (http://www.fiddler2.com)


·        SQL Profiler: Can download from
(http://msdn.microsoft.com/en-us/library/ff650699.aspx)


·        Performance Monitor( Perfmon.exe): One of the major advantages is that you can set it to capture information about specific c things at intervals over time. Download from below link

         (http://www.microsoft.com/en-us/download/details.aspx?id=24832)

SharePoint Tools to use: 

·        DebugDiag
·        netmon
·        Fiddler2BetaSetup
·        Log Parser
·        PAL_Setup_v2.1_x64
·        SharePoint2010AdministrationToolkit
·        Sharepointctf
·        SharePoint Viewer-Debug
·        SharePoint Viewer-Ship
·        SPDisposeCheck
·        SPSReport
·        UlsViewer
·        WFetch
·        WSSDumpUPerms07

Please Comment if you need Any Help.Your Feed back is always Welcome.I Am Happy to Help !!!!!

Trouble shooting SharePoint with Logs and Configuration of Developer Dash board

Trouble shooting SharePoint with Logs and Configuration of Developer Dash board

Trouble shooting SharePoint with Logs:

        SharePoint issues can be resolve by checking the Logs below

·        Application Logs
·        System Logs
·        ULS logs
·        Developer Dash board Tool.

Configuration of Developer Dash board: we can check the logs on developer dashboard tool to get the detailed.Follow the Below steps to configure.

·        To enable dashboard you need to create the Usage and Health Data Collection Service Application before.

·        Go to Monitoring->click on Configure usage and health data collection.


·        Check the box to enable usage data collection->ok 


·        Once you have created the service application you have to enable the dashboard.
·        To enable the dashboard, we will use ON setting and use the below power shell command.

$svc = [Microsoft.SharePoint.Administration.SPWebService]::ContentService
$dds = $svc.DeveloperDashboardSettings
$dds.DisplayLevel = "On"
$dds.Update()


·        After executing the above power shell command open your site on top right hand side of your site, you can see an icon to launch Developer Dashboard. Please see below Figure


·        Can see the below detailed screen once click on dash board. we can find logs here to get the error details.


Please Comment if you need Any Help.Your Feed back is always Welcome.I Am Happy to Help !!!!!

ShareThis

X